3D ULPIN
Mapping System.
3D ULPIN Mapping System: Backward-Compatible Volumetric Extension of India's ULPIN Framework for Three-Dimensional Land Administration
Abstract
- This study addresses the gap between India's traditional 2D cadastre and the need to model volumetric property. India's land records modernization (DILRMP) and ULPIN ("Bhu-Aadhaar") provide a geo-referenced 2D base, but multi-level buildings, underground utilities, and air-rights require a 3D extension.
- International benchmarks: Singapore's coordinated, survey-based cadastral system ensures precise geospatial reference and supports strata titles and subterranean parcels, without altering its base parcel identifier. The Netherlands has prototyped 3D cadastral objects linked to 2D parcels in their LADM-based model. These cases suggest a "2D-first, 3D-where-needed" approach.
- We propose the 3D ULPIN mapping system architecture: keep the existing 2D parcel ID (ULPIN) and attach child volumetric objects (buildings, floors, units, tunnels, etc.) under it. Each 3D object gets a derivative Volumetric Property Reference ID (VPRID) encoding its parent ULPIN, building, floor and unit. This preserves backward compatibility and legal continuity.
- Multi-modal spatial data (drone imagery, LiDAR, CAD/BIM, GNSS/CORS, terrain models) are fused in an asynchronous processing pipeline. AI algorithms extract building footprints, heights and 3D mesh candidates from this data. A human-in-the-loop (licensed surveyor) then reviews and adjusts each 3D model before official registration.
- The system follows open standards: ISO 19152 (LADM) for the land administration information model, CityGML 3.0 for semantic 3D building models, and OGC 3D Tiles for streaming 3D visualization. Data are stored in PostGIS with 3D extents and in an object store for large assets (point clouds, tiles).
- Key research tasks include prototyping AI modules, designing a compliance-check engine (building codes, subsurface hazards), and planning a data-collection strategy. We outline experiment plans (segmentation accuracy, height error, topology validity, query performance) with placeholders for results. No empirical results are claimed yet; this framework sets the stage for detailed evaluation.
- This work aims to chart a practical roadmap (ULPIN to VPRID, async AI+human validation) rather than purely theoretical conclusions. It makes assumptions (unspecified pilot area, generic data sources, available GPU resources) and avoids untested claims. The goal is a clear, publishable plan for a national-level research effort in 3D cadastral engineering.
Introduction
India's land administration is undergoing rapid digital transformation. The Digital India Land Records Modernization Programme (DILRMP) has computerized approximately 95% of rural land records and 68% of cadastral maps. A key innovation is the Unique Land Parcel Identification Number (ULPIN or "Bhu-Aadhaar"), a 14-character code tied to a parcel's geographic location. Over 66% of agricultural parcels have been assigned ULPINs as of 2026. This georeferenced 2D base immensely improves transparency and dispute resolution.
Nonetheless, 2D cadastres are insufficient for modern urban and infrastructure challenges. Consider a plot with a 5-story apartment building and an underground parking: residents on different floors have distinct rights, yet under a 2D system they all share one ULPIN. Likewise, buried utilities or elevated metro lines overlap existing parcels. Without volumetric modeling, authorities cannot fully capture ownership or enforce rules that depend on elevation (e.g. maximum building height, minimum clearance).
Concurrently, India’s SVAMITVA scheme has demonstrated large-scale geospatial mapping: UAVs have surveyed over 90,000 rural villages to create property maps and issue 1.08 crore property cards. The Survey of India uses survey-grade drones and CORS references to ensure ±5 cm accuracy in these village maps. This shows India’s growing capability in precision geospatial data, which our proposal also leverages.
Problem statement: How can India augment its existing ULPIN-based cadastre to capture multi-level ownership and built structures, while remaining compatible with current laws and workflows? We propose the 3D ULPIN mapping system: a layered model where each 2D parcel (ULPIN) may host subordinate 3D spaces. Our objectives are:
- Extend identification: Define a scheme (VPRIDs) for unique IDs of 3D volumetric units (buildings, floors, tunnels) that derive from the parent ULPIN.
- Define data pipeline: Outline AI and geospatial processes to generate 3D models from multi-modal data (drone images, LiDAR, CAD, GNSS, etc.).
- Ensure compliance: Incorporate topology checks and a surveyor validation step to guarantee that each 3D model meets legal accuracy standards.
- Prototype architecture: Design a system with asynchronous processing, open standards (LADM, CityGML, 3D Tiles), and a 3D spatial database to store and serve the models.
Literature Review and International Context
Singapore: Geocentric Cadastre
Singapore’s Land Authority (SLA) maintains a modern, coordinate-based cadastral system. Since 2004, all surveys use the SVY21 datum and a tightly controlled survey network. This allows very precise placement of parcels and strata lots. Singapore introduced strata titles (for condominium units) in the 1960s, layering apartment ownership on a ground parcel ID. Subterranean and air-space subdivisions (for tunnels or telecom towers) are also supported by referencing the original surface lot. Importantly, SLA kept the base parcel ID intact and added layers for vertical units, illustrating our “inherit and extend” strategy. The Singapore model also highlights rigorous survey verification: every proposed change is checked against permanent ground markers and control networks, a practice we incorporate as the human-in-loop review.
Netherlands: Phased 3D Cadastre
The Dutch Kadaster pioneered 3D cadastral concepts. Early studies (Stoter & Ploeger 2003) identified multi-level housing and underground rights as motivations for 3D registration. Their approach, aligned with ISO 19152 (LADM), treated 3D legal spaces as separate “spatial units” linked to 2D parcels. In a 2013 prototype, they stored volumetric objects (e.g. building solids) in a 3D database, while maintaining traditional 2D rights records. Key lessons: (a) Existing legal infrastructure can remain largely 2D if each 3D unit is an extra record; (b) visualization (CityGML models, 3D GIS) aids stakeholders, but the core is the data model of objects and rights; (c) accuracy requirements are strict (survey tolerances) – hence our explicit surveyor verification step. The Dutch work reinforces that the 3D ULPIN mapping system should be incremental: we do not replace ULPIN, we only add new record types (Building, Floor, Unit, Infrastructure) with reference to it.
Other Experiences
Several jurisdictions have piloted 3D cadastres (e.g. Sweden, Australia, Czech Republic). A 2020 review noted that while many have surveyed 3D objects, very few have operationalized them in law. Common challenges include defining air/subsurface rights and integrating BIM. Our approach avoids diving into legal reform; instead we assume the cadastral system is willing to store 3D objects as metadata, and put the onus on surveyors to attach those objects to existing laws. In practice, a government or court would need to validate any new 3D registration, beyond our technical scope.
Conceptual Data Model
Figure 1 illustrates the hierarchical model. Each 2D parcel (ULPIN) is the root. An envelope Volume (Building) is created above/below it. That volume is subdivided into Floors, and floors into Units (e.g. apartment units, common areas). Separately, the same parcel can be linked to Infrastructure volumes (tunnels, vaults, utility corridors) and Air-volumes (e.g. defined by height restrictions). Thus a multi-story block yields multiple registered “objects” all linked to one ground parcel.
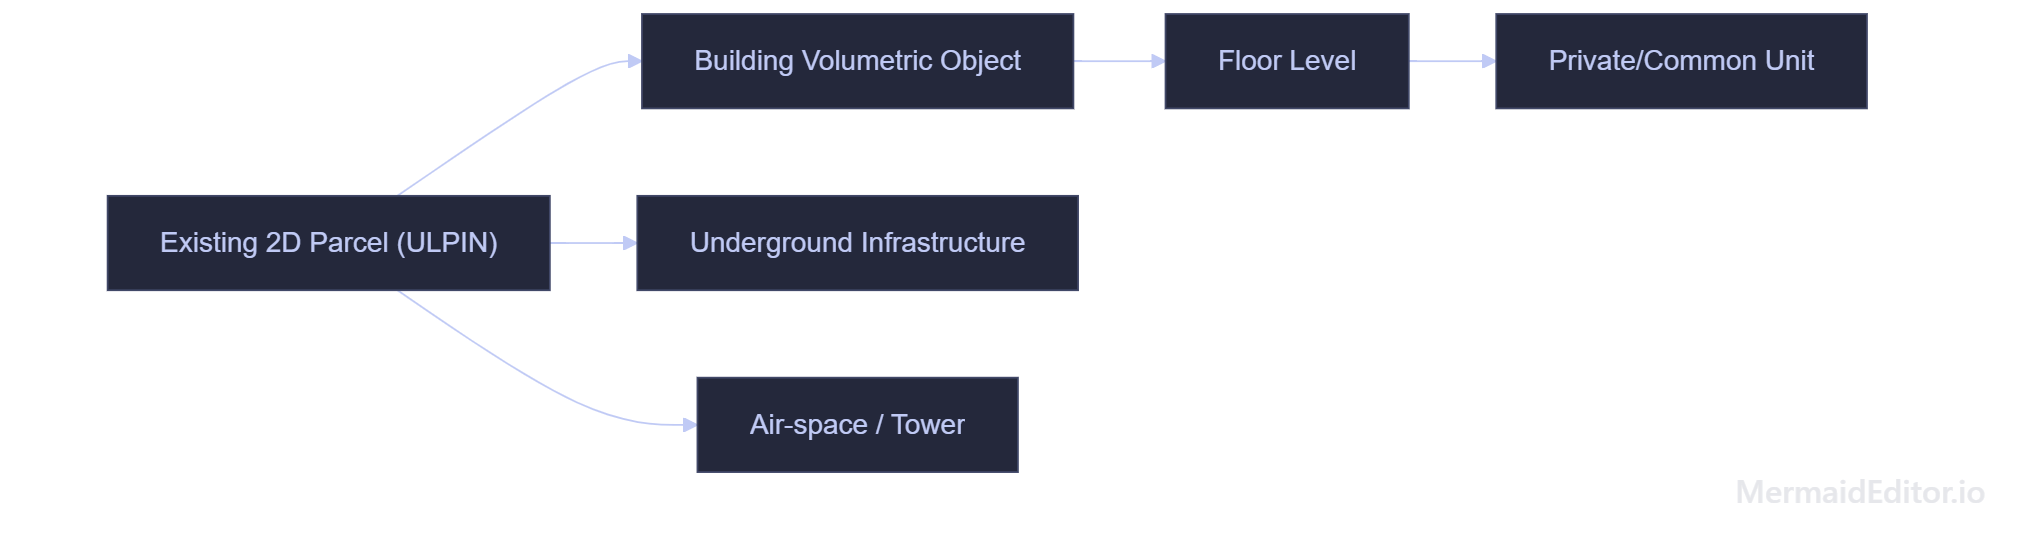
Fig. 1. Conceptual hierarchy: a ULPIN-bound parcel (2D) can host a 3D building, which contains floors and units; utilities (tunnels) and air-rights can also attach to the same parcel.
VPRID Identifier Scheme
We introduce a research notation for object IDs. Let the root ULPIN be ULPIN. A building object under it might be assigned VPRID = [ULPIN]/B-[building-id]. Floors add a segment /F-[floor], and units /U-[unit]. For example, ULPIN/BLD-001/F-03/U-05 identifies Unit 5 on Floor 3 of Building 001. To encode the 3D extent, a suffix (e.g. #OCT-hex) could add a hash of the geometry, but that is optional. This hierarchical ID aligns with ISO 19152/LADM principles: each spatial unit has a unique identifier, independent of any rights or restrictions it may carry. In practice, VPRIDs would be machine-generated and stored alongside ULPIN in the cadastral database.
Mathematical Model (sketch)
Formally, let a parcel footprint be a planar polygon P. A volumetric unit V is defined by a horizontal base subset P'⊆P and a vertical interval [zmin, zmax]. For a floor F composed of units Ui: F = ⋃i Ui, where Ui = Pi × [zi, zi+hi]. We enforce that interiors of distinct Ui do not overlap (non-overlap constraint) and that each Ui is a valid 3D solid (closed, manifold). Topologically, a building volume should be genus-0 (no holes) and watertight. In implementation, each candidate volume is checked via a geometry engine: Euler characteristic, no self-intersections, and disjointness of separate units. This ensures data quality before registration.
System Architecture
Figure 2 shows the five-tier platform design. It adopts a modern web architecture (similar to existing e-governance systems) with spatial emphasis.
- Tier 1: Presentation. Web interfaces: a 2D GIS viewer (MapLibre/OpenLayers), a 3D web client (CesiumJS), a surveyor editing portal, and public query portal. 3D content is streamed via OGC 3D Tiles (an open format for large 3D scenes).
- Tier 2: API/Gateway. A FastAPI backend provides REST/gRPC endpoints for map queries, 3D asset streaming, and user management (with OAuth2/JWT). It also handles task submission to the processing layer.
- Tier 3: Async Processing. A message queue (Redis/Celery) connects to workers: (a) Image/LiDAR preprocessing; (b) AI modules (building segmentation, height regressor, change detection); (c) 3D reconstruction workers; (d) Topology validation; (e) Law/Regulation checkers. This design scales out on GPU servers (e.g. DGX cluster).
- Tier 4: Spatial Data Storage. A PostgreSQL+PostGIS database holds parcel polygons, building solids, floor/unit volumes with VPRIDs. PostGIS 3D features allow spatial queries. An object store (MinIO S3 or similar) keeps large assets (point clouds, mesh files, 3D Tiles). A vector index (e.g. pgvector) may store building embeddings for semantic search.
- Tier 5: Governance & Analytics. Specialized engines run on the spatial data: building bylaw checker (detect zoning/height violations), subsurface clash engine (test planned excavations against utility models), and a blockchain-inspired audit log for recording approvals. A chatbot can answer policy queries from the database.
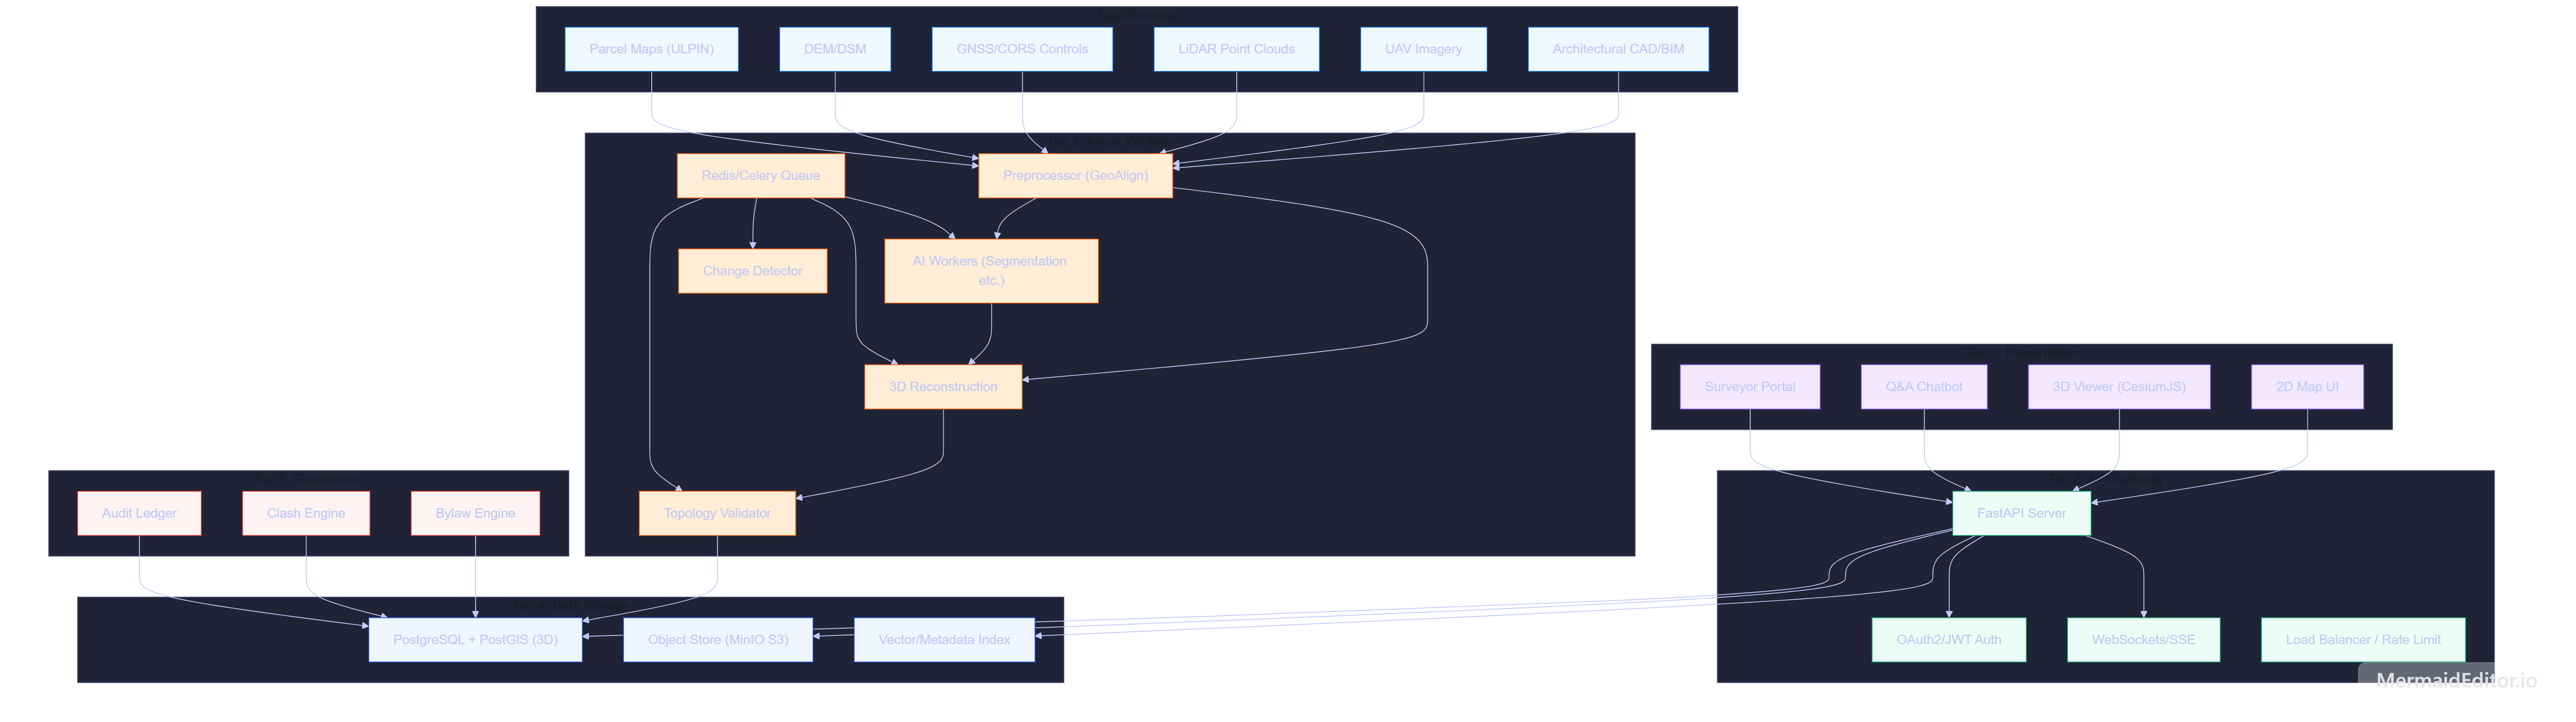
Fig. 2. System architecture (five-tier). Multi-modal data (left) are preprocessed and fed into AI/3D workers. Clients connect via API. Spatial results are stored in PostGIS 3D and used by compliance engines. 3D visualization uses 3D Tiles.
Multi-Modal Data-Fusion Pipeline
Figure 3 zooms into the spatial data workflow. Raw sources are georeferenced to a common CRS using GNSS control points. Key steps:
- Geo-Alignment: Tie all data (images, LiDAR, CAD plans) to the cadastral base map via control points.
- Segmentation: AI (e.g. U-Net or transformer) segments building footprints from orthophotos or DSM.
- LiDAR Classification: Filter LiDAR points into ground, building, vegetation using standard tools.
- Height & Volume Estimation: Estimate roof height per footprint (e.g. 95th percentile of points) and create a preliminary solid by extrusion. Floor counts may be inferred by height or BIM plans.
- Reconstruction: Fuse footprints, heights, LiDAR, and BIM to output a candidate 3D mesh or solid. (Future work: train a dedicated “Bharat3D ReconNet” for automated meshing.)
- Change Detection: Compare new imagery/point cloud with a historical baseline via a Siamese network to flag new construction or demolitions.
- Validation: Run geometric checks on each candidate solid. Reject or refine any that fail topology (non-watertight, self-intersecting, overlapping volumes).
- Surveyor Review: Present the finalized 3D model in an editor. The surveyor adjusts vertices or splits/joins units as needed. Upon approval, the model (with VPRID) is committed to PostGIS.
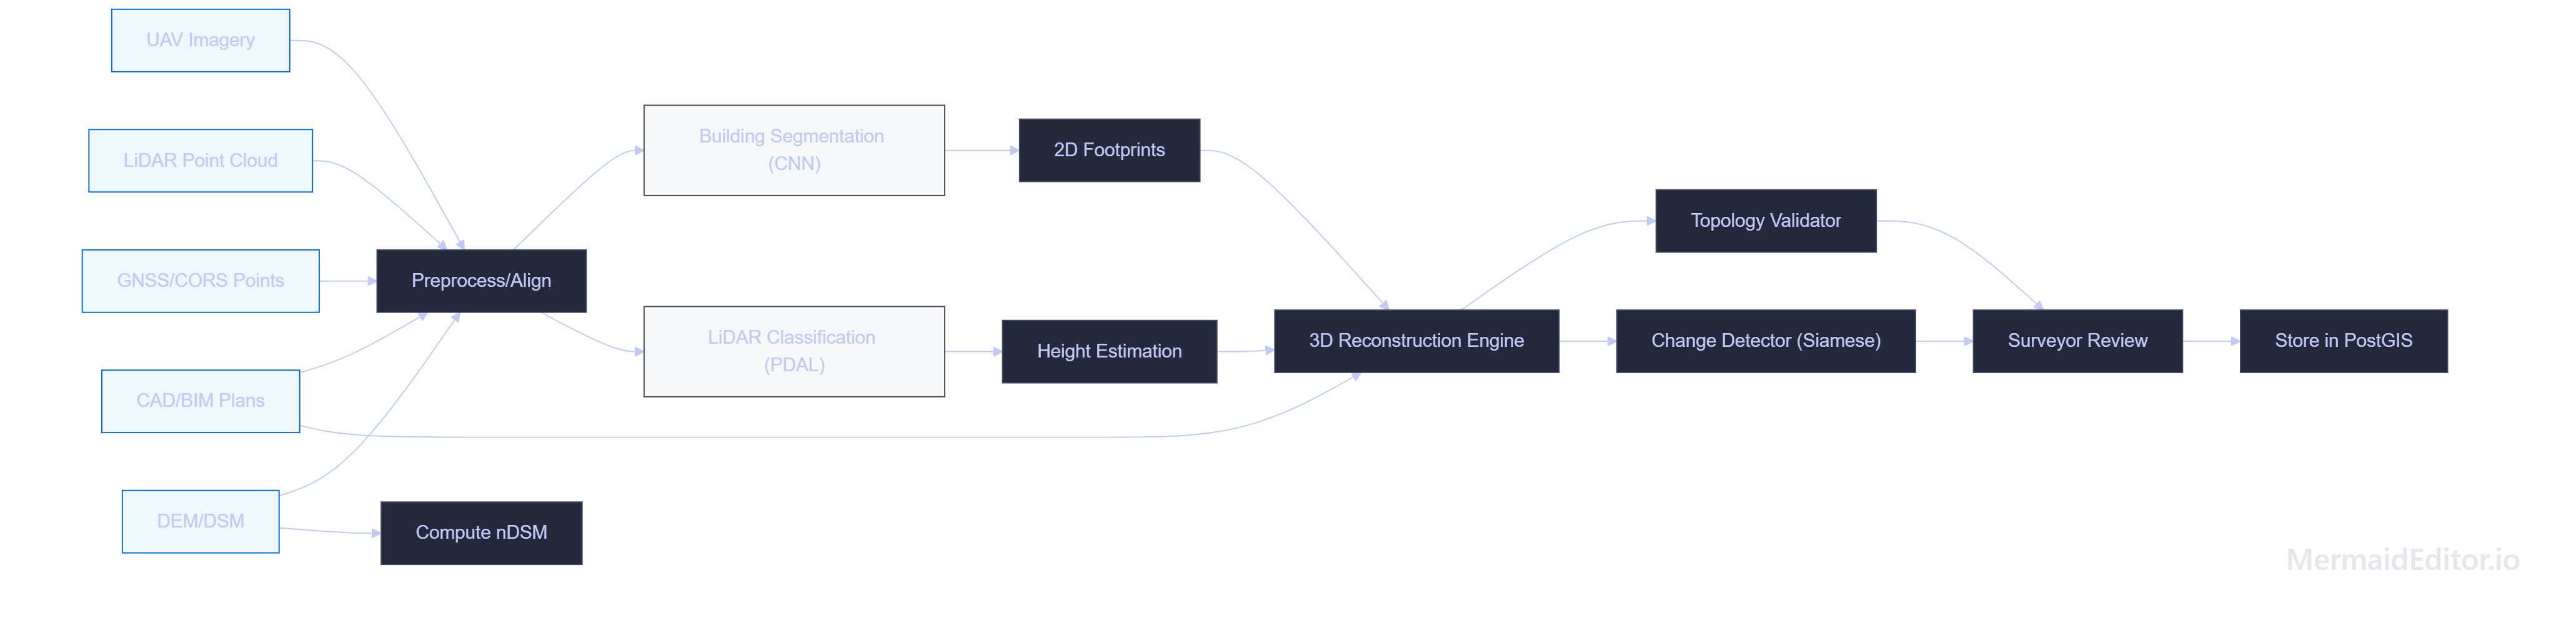
Fig. 3. Data-fusion pipeline. Raw inputs are georeferenced, then AI extracts building footprints and height. A 3D reconstruction module fuses all data into a candidate model, which is then topology-checked and sent for surveyor approval.
AI-Based 3D Reconstruction Workflow
The AI pipeline has modular components:
- Building Segmentation: A CNN or transformer processes orthophotos and normalized DSM (nDSM) to predict building footprints and roof areas.
- LiDAR Processing: A point cloud network separates ground vs non-ground points. Building points above each footprint are clustered to refine roof shape.
- Height Prediction: Statistical measures (e.g. 95th percentile LiDAR height) or a regression model estimate roof elevation. Floor count can be derived by height/typical story height.
- 3D Meshing: Extrude the 2D footprint to the estimated height, then apply roof profiles (flat, gable, etc.) from BIM info. For complex buildings, merge multiple extruded parts. Output is a watertight solid (in CityGML or glTF format).
- Change Detection: A Siamese convolutional network compares a pair of images/point clouds (past vs present) to identify differences (new building, extension). Changed areas are highlighted for targeted processing.
- Uncertainty Flagging: Each AI result carries a confidence score. Low-confidence cases are prioritized for surveyor review.
All AI-derived 3D objects are provisional. The final step is a Surveyor-In-The-Loop: a human checks and edits the model in a 3D viewer. Only after the surveyor digitally signs off does the system record the 3D object as official. This mirrors current practice (legal survey reports) and ensures accountability.

Fig. 4. AI-assisted 3D reconstruction: inputs feed segmentation and LiDAR analysis, producing a candidate 3D solid; detected changes are noted; a surveyor then reviews and finalizes the model.
Prototype & Repositories
We reviewed two student prototypes. Partha-Shankar/011 (GitHub) contains a skeleton FastAPI server and some GIS functions. It defines database schemas for parcels and buildings, but lacks implemented AI modules or a 3D viewer. The UI is minimal. 3dulpin (GitHub) has sample scripts for data ingestion and a simple UI, but no end-to-end workflow. Both lack test data and do not fully implement the 3D topology or VPRID concepts. However, they illustrate basic frameworks. Gaps identified: no automated mesh generation, no schema for floors/units, and limited error handling. These will guide our full prototype development.
Evaluation Plan
We outline planned experiments. Actual results are future work (marked TBD).
| Experiment | Metric(s) | Notes |
|---|---|---|
| Building Footprint Extraction | IoU, Precision, Recall | Compare AI-predicted roof outlines vs ground-truth parcel data or hand-labeled footprints. |
| Height Estimation | Mean Abs Error (m), RMSE (m) | Compare predicted roof heights to LiDAR-derived heights or field surveys. |
| 3D Topology Validity | Count of geometry errors (non-watertight, overlaps) | Automated check of candidate solids; score should be zero errors post-correction. |
| Database Query Performance | Query latency (ms) on PostGIS | Measure average query times for spatial lookup by ULPIN, VPRID, and by-location with increasing database size. |
| Change Detection Accuracy | Precision, Recall | On a test set of known construction changes, measure detection rates. |
Datasets: We assume a sample city block with known building shapes and LiDAR (e.g. an open OSM/LiDAR dataset) for initial tests. Compliance tests will use hypothetical zoning rules. All benchmarks will be noted as “TBD” until implemented.
Discussion
The 3D ULPIN mapping system bridges India’s land records with modern 3D capabilities. Unlike a mere 3D mapping tool, it ties each 3D object to legal metadata (owner, rights, source data). For example, a condominium unit’s 3D solid in the database has fields: VPRID, parent ULPIN, owner info (linked from registration), creation date, and GIS metadata. This integration of geometry and land registry is the core contribution.
We adhere to international standards to maximize interoperability. Using CityGML (or its JSON equivalent) means detailed semantic models (e.g. roof types, construction year) can be encoded. For large-scale visualization, 3D Tiles allows streaming entire cityscapes in the browser. However, data standardization does not eliminate governance needs: our system still requires human validation. The digital surveyor review is essential to meet legal evidentiary standards (as in Singapore and Dutch practice).
Potential impacts: Urban planning officials could query the 3D database for floor-area calculations, shadow studies, or subsurface utility conflicts. Land records would become richer: a landowner could retrieve the 3D boundary of their apartment. Financial institutions might use 3D property models to assess collateral. These applications hinge on having accurate, linked 3D data; our architecture enables that.
Limitations
- Data Gaps: We assume access to high-quality drone or LiDAR data. In reality, many areas lack such surveys. The prototype may rely on small test areas or simulated data.
- Legal Adoption: The system can store a 3D model, but by itself does not change land law. Official recognition of a volumetric title is beyond the tech scope.
- AI Uncertainty: Machine learning may mis-segment or mis-measure. We mitigate this with manual review, but some errors may still occur. Extensive labeled training data for Indian buildings is currently limited.
- Scalability: A national deployment would involve terabytes of spatial data and heavy compute. Our design is scalable in principle (cloud or HPC), but actual performance testing remains future work.
- Security/Privacy: Land and building data are sensitive. We propose standard security (authentication, audit logs), but detailed measures (e.g. India’s social ID linkage, encryption at rest) need alignment with policy, not covered here.
Conclusion
We have outlined the 3D ULPIN mapping system: a research blueprint for 3D cadastre in India. By respecting the existing ULPIN system and using AI-assisted 3D modeling with human oversight, we seek a practical path forward. The key innovation is the layered identifier (ULPIN→VPRID) that connects 2D parcels to volumetric objects. Our architecture integrates heterogeneous data and modern web-GIS standards to deliver 3D insights without disrupting current processes. Though experimental results are pending, this framework provides a clear direction for implementation and study. The next steps include building the prototype components, testing on pilot regions, and iterating with stakeholders to refine the approach.
References
- Survey of India (Ministry of Panchayati Raj), 2025. Drone Survey for SVAMITVA Scheme. Press Information Bureau (India). [Online] Available: https://www.pib.gov.in/PressReleasePage.aspx?PRID=2200803.
- Department of Land Resources, India, 2026. Secretary’s briefing on Digital Land Records Modernization. Press Information Bureau. [Online] Available: https://www.pib.gov.in/PressReleasePage.aspx?PRID=2263740.
- Department of Land Resources, India, 2024. Press release: “95% of Land Records in Rural India Digitized”. Press Information Bureau. [Online] Available: https://www.pib.gov.in/PressReleaseDetail.aspx?PRID=2068408.
- Open Geospatial Consortium, 2022. OGC CityGML 3.0 – City Geography Markup Language. OGC Standard (ISO 19107-based 3D City Model). [Online] Available: https://docs.ogc.org/is/20-010/20-010.html.
- Pinkos, H. (CesiumJS Blog), 2019. “OGC adopted 3D Tiles as a Community Standard for streaming massive 3D content.” [Online] Available: https://cesium.com/blog/2019/03/01/cesiumjs-version-1.55-released/.